
Winning the AWS IIoT Hackathon

Imagine you own a wind turbine farm. Yes, those huge white fan-like things you see when you’re driving out in the middle of nowhere. You had a great last year and just ordered ten new turbines to grow your business. How do you know where to put them to maximize power generation and profitability?
I’d never even considered a scenario remotely like that when I started at Amazon Web Services, but I joined the Industrial Internet of Things (IIoT) organization where we help customers answer those types of questions. You the business owner can use smart sensors to send data - like revolutions per minute or wattage - to AWS for aggregation. With your data in one place, you can use it to make business decisions like what plot of land would be best for your new turbines.
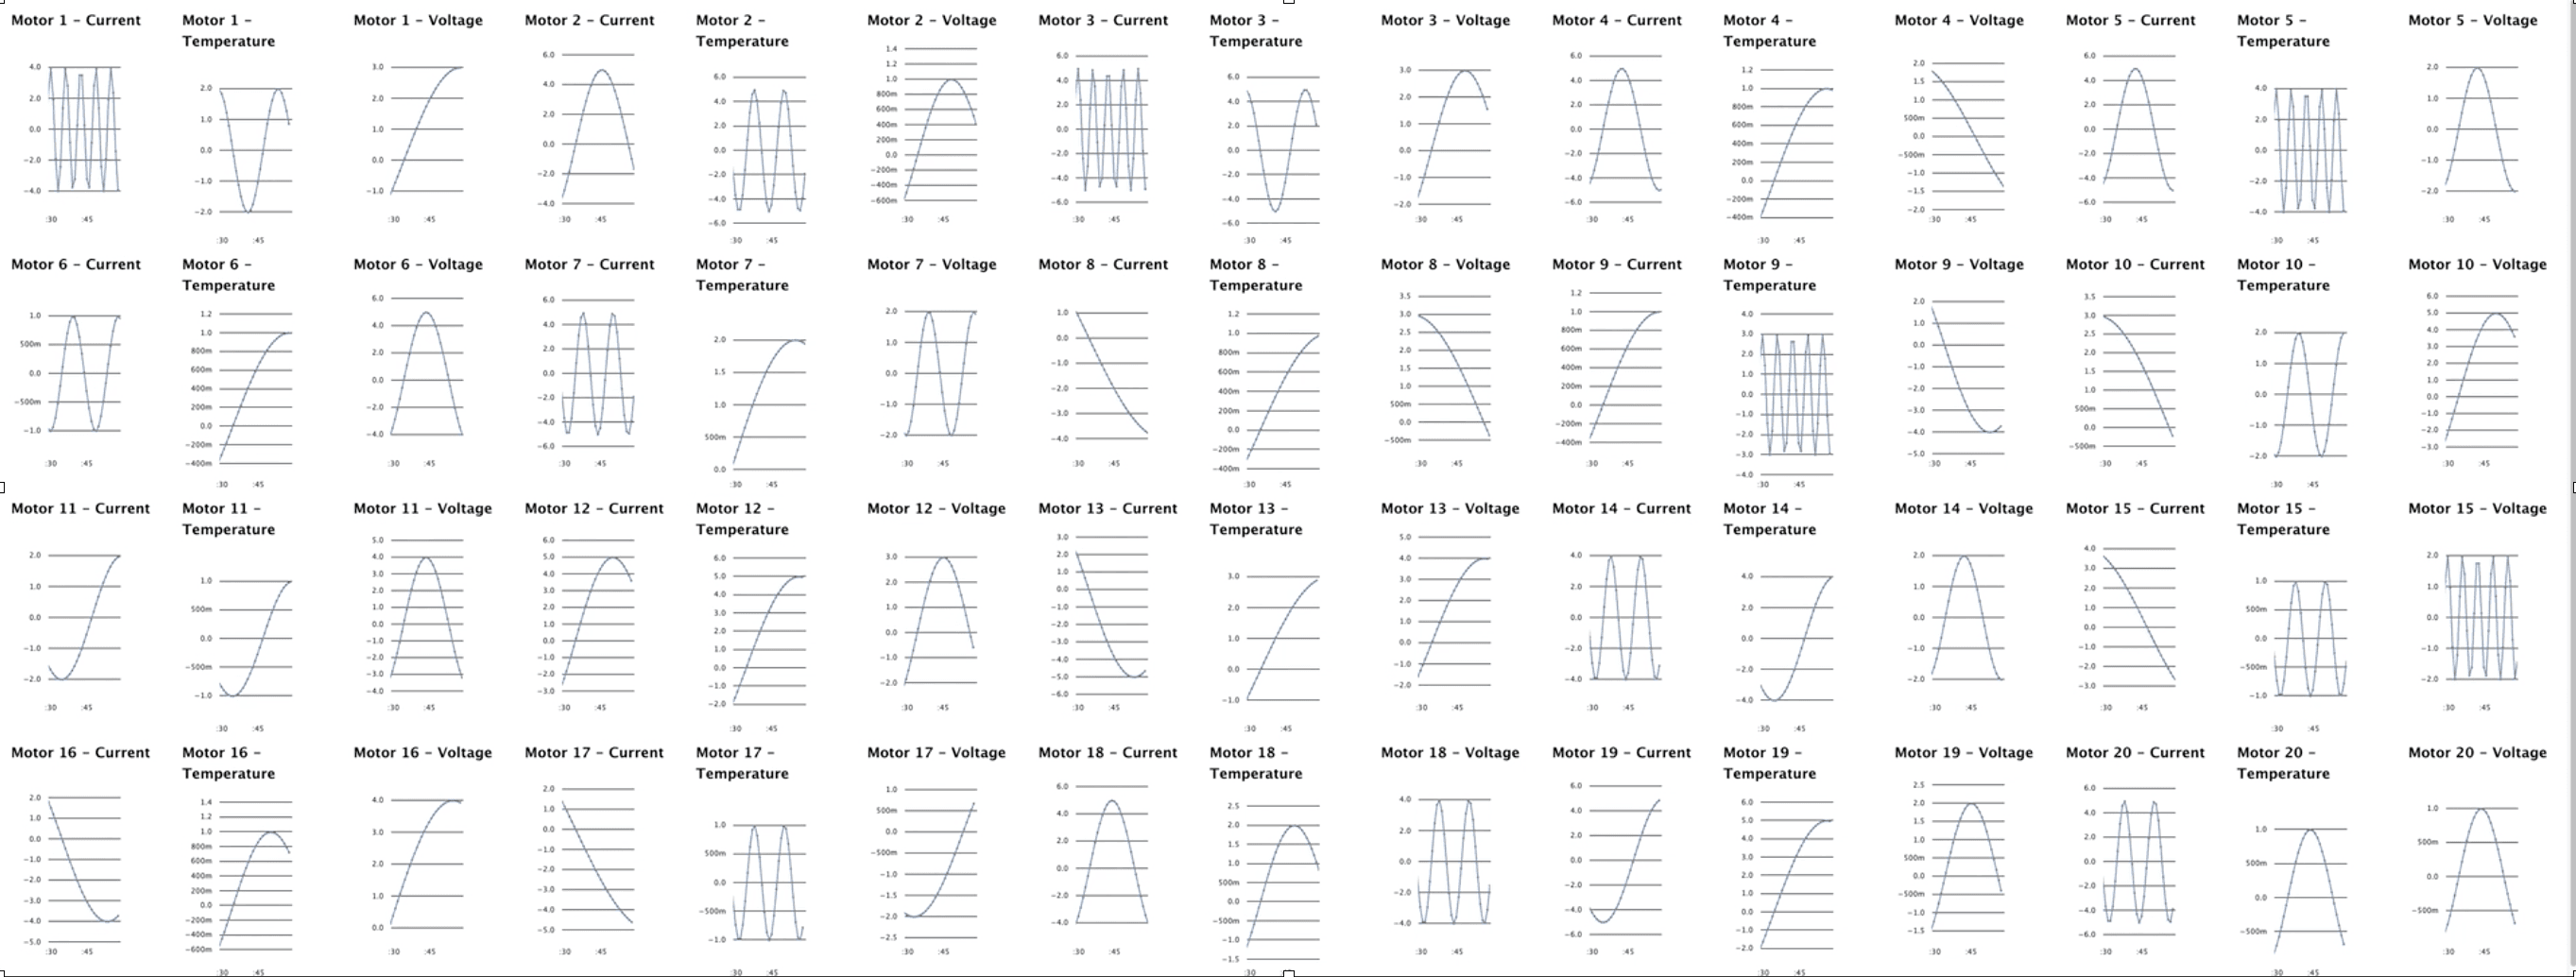
The product I’m responsible for is SiteWise Monitor. It lets you build dashboards that visualize your data in time series graphs - or better said, a bunch of charts representing data over time. Below is an example:
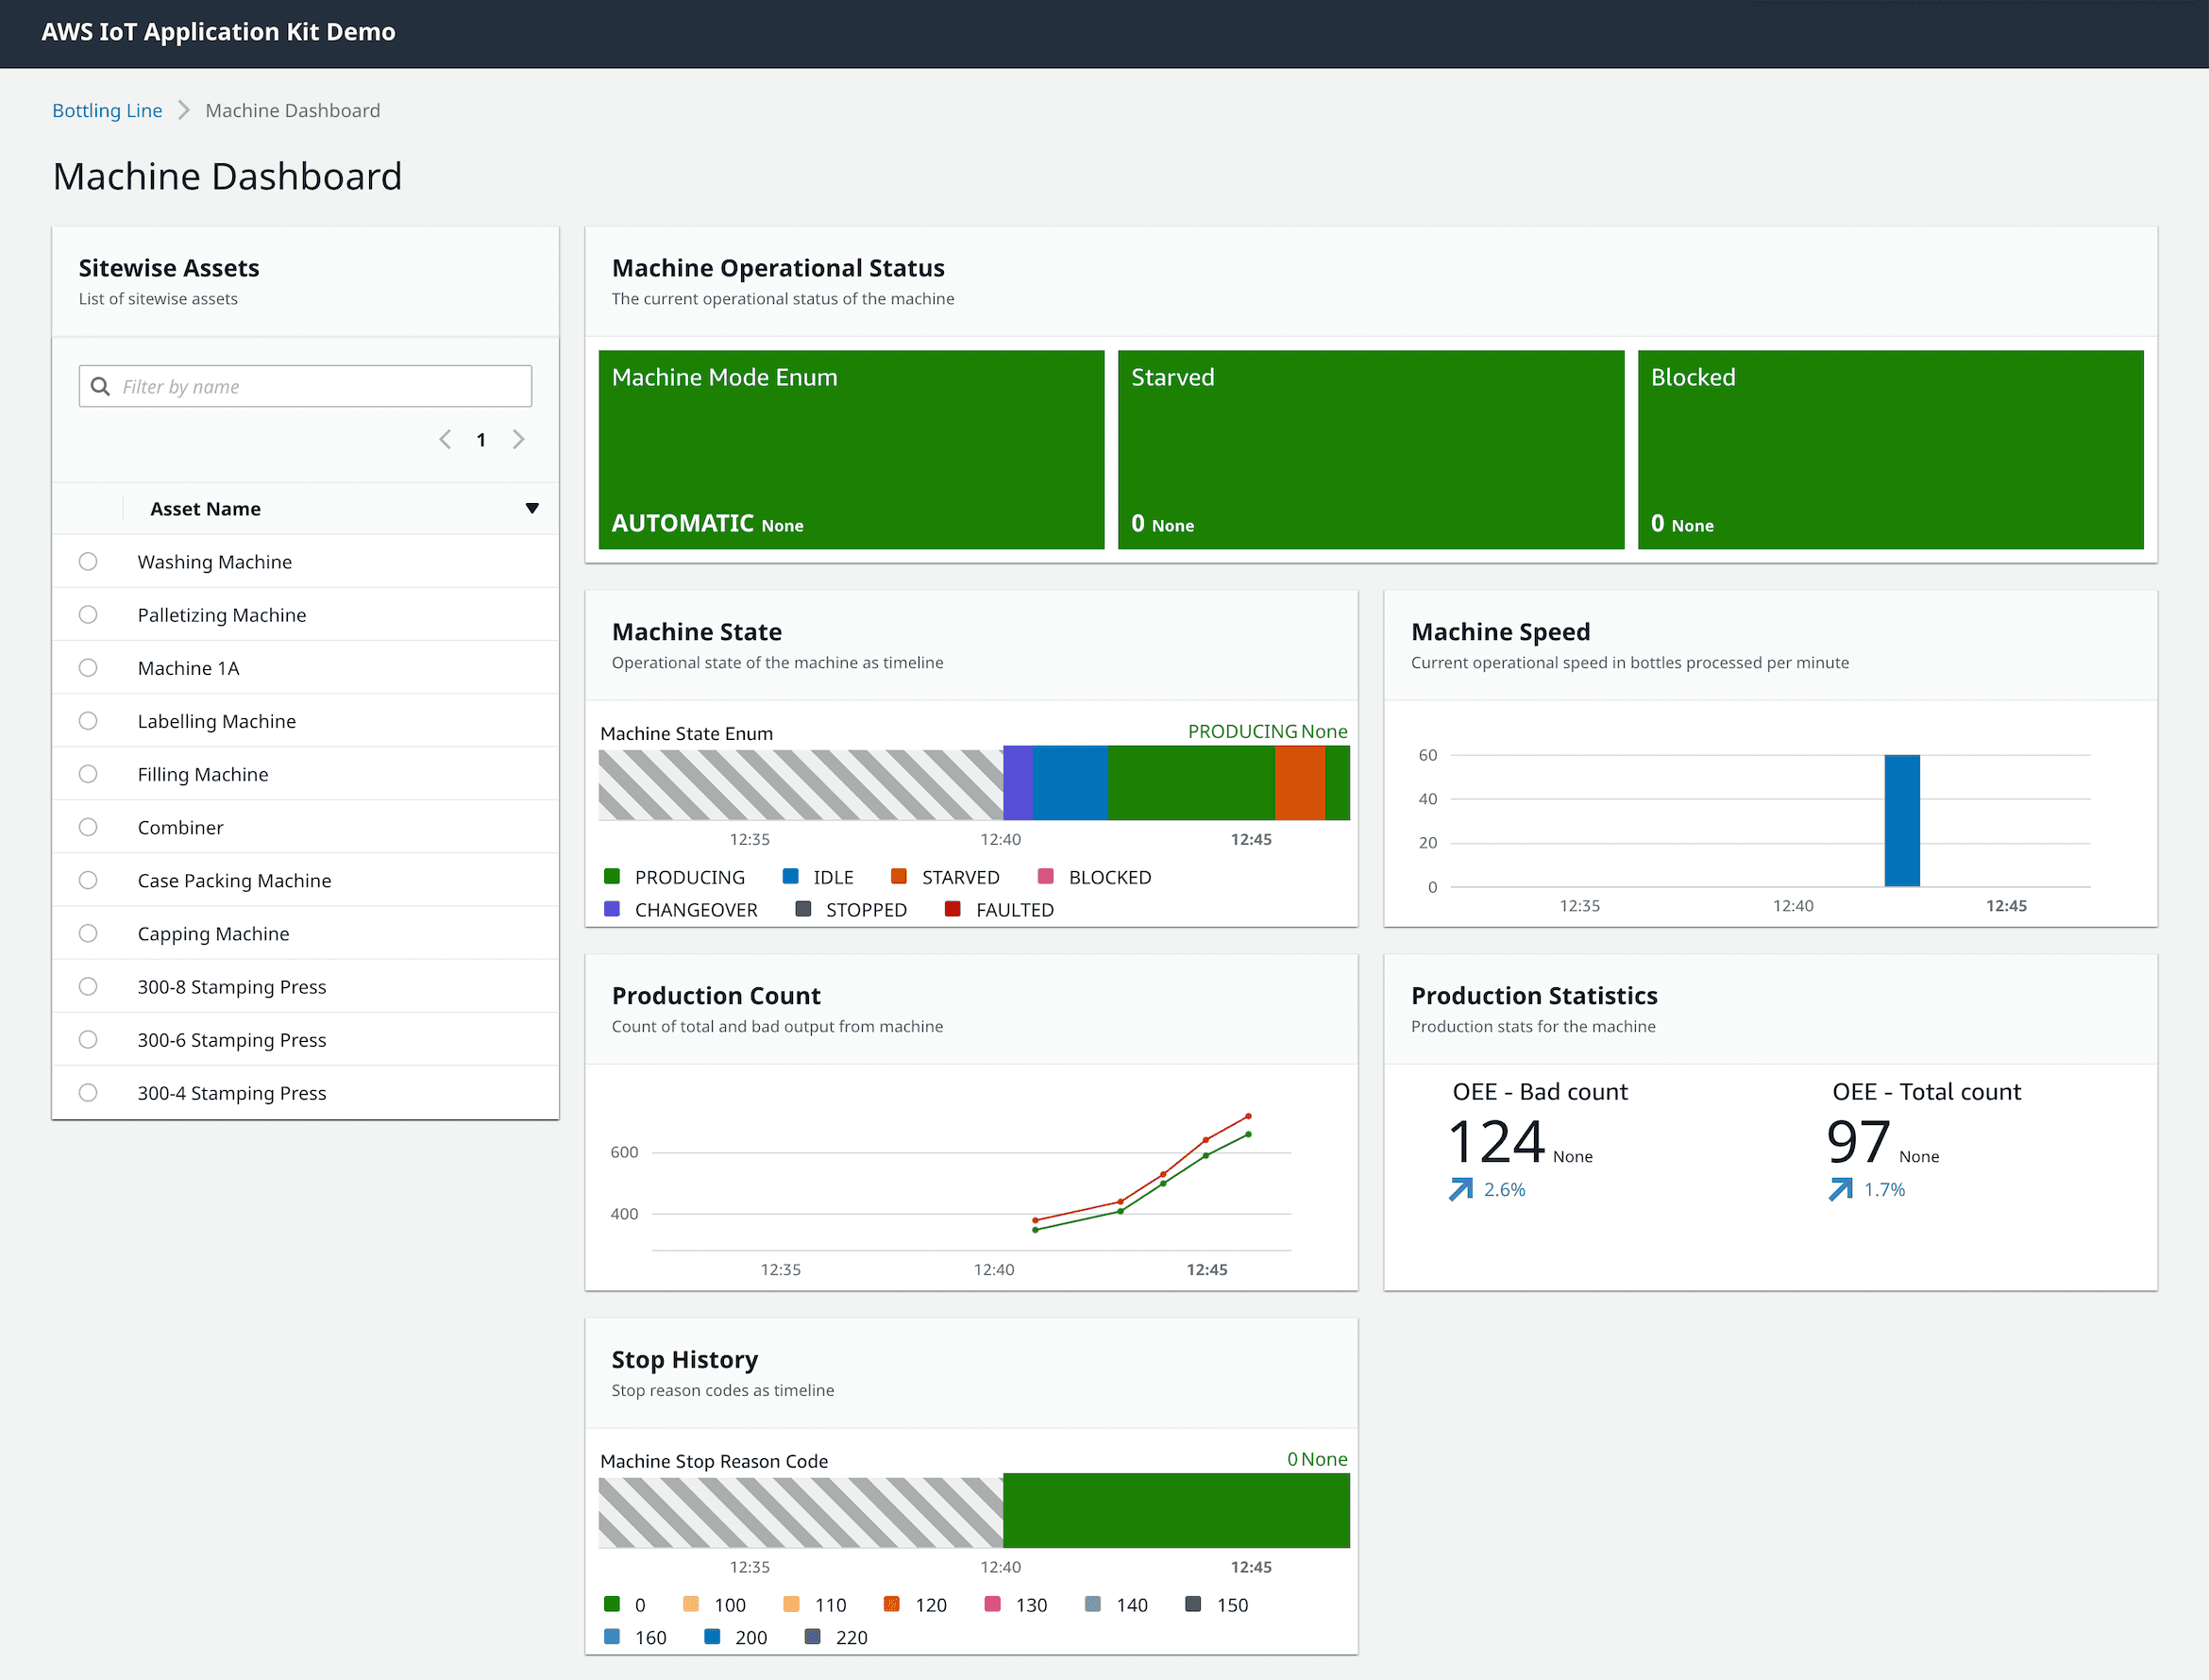
Behind these dashboards is an open-source project called Iot-App-Kit. It’s what connects the charts on your screen to the data you sent to AWS. It allows my team to build SiteWise Monitor but also lets more technical customers create custom dashboards. It powers some pretty sweet data visualizations!
The most powerful feature of these dashboards is that the data updates in real-time. The sensor on your wind turbine can send a metric to AWS and you’ll see it in a chart a couple of seconds later. Let’s go over how that works.
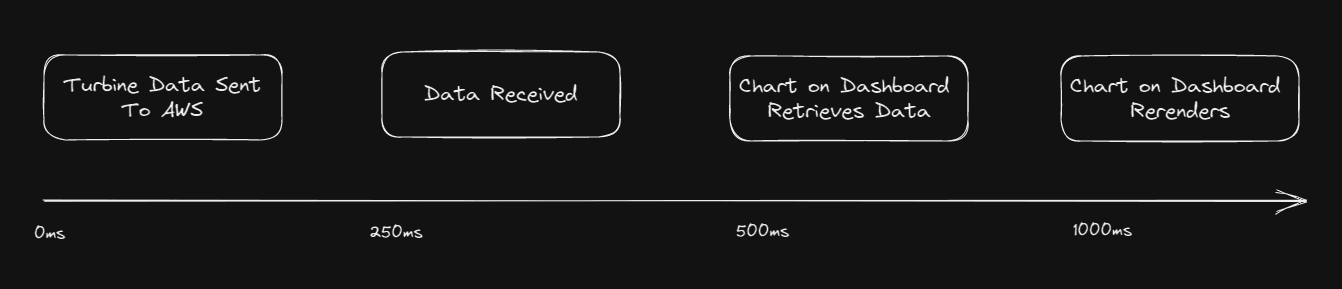
Say you want to view the last minute of one of your turbines data in a line chart. That’s a pretty short timeline - we’ll need to get that graph updated frequently, maybe once per second. In that second, the web browser will retrieve the latest data, store it on your client, and re-render the chart with the new time span and data. There’s a lot more complexity when you start rendering multiple charts, batching requests, sharing data between charts, and panning around the timeline. Ultimately, you send data to AWS and we’ll visualize it for you.
On December 6th I got a Slack notification. “You’ve been added to #aws-iiot-2022-year-end-hackathon". Shorty after an email detailed a six-week long competition encouraging us IIoT developers to collaborate and build innovative things across our organization. On the signup page, one particular project titled “Iot-App-Kit Web Socket Streaming” caught my attention.
A couple of days later I was in a meeting with two new teammates I’d never interacted with prior. Both of them were much my senior in both tenure and technical competency. They were great to work with! Within half an hour or so I had a much better understanding of the project and how I would contribute.
Our goal was to change how data is put into the charts on dashboards. We hoped that by improving that process we’d be able to improve performance, reduce latency, and save customers money. We’d accomplish this by streaming the data over web sockets.
Streaming? Like streaming another episode of Survivor? Not quite. Streaming refers to data being delivered continuously over time. Web sockets are a way to facilitate the transfer of data over the internet. Data is anything from a video recording, an audio clip, or in our case a piece of machine data.
The ultimate goal was to eliminate the current long polling method where data is requested by dashboards and replace it with web socket streaming where data is sent to the dashboard.
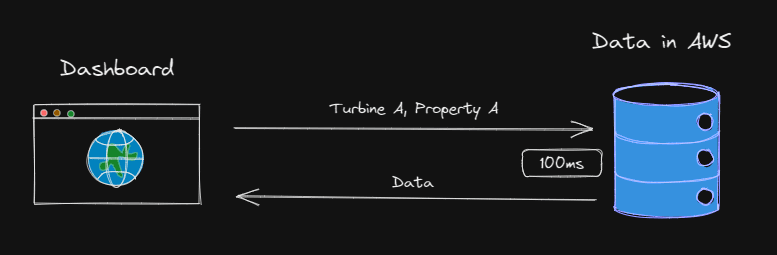
Above is how a single request for data works with the current long polling implementation. The dashboard that runs in your browser will create an HTTP request. The request is opened and a message is sent to a server asking for some specific data. The server then responds with the data you asked for and the request is closed. This all takes a bit of time depending on how far away you are from the server and how much data you requested.
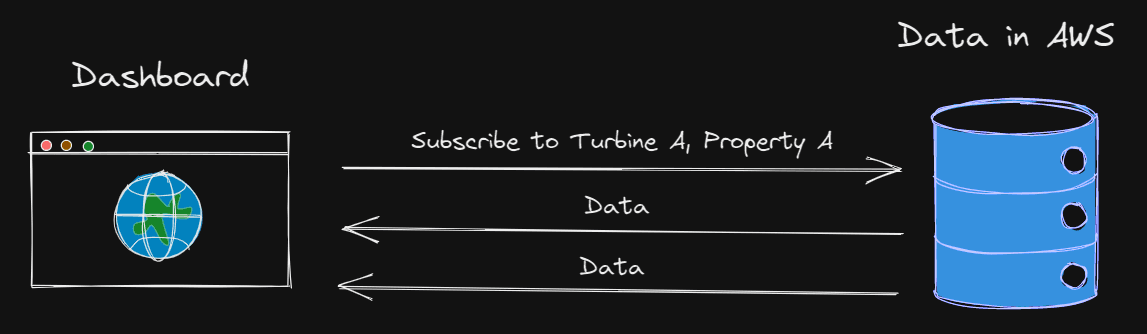
With a web socket implementation, a long-living connection is established between the dashboard and the server. Instead of many outbound messages sent asking for specific data, few outbound messages are sent that subscribe to data streams. When data is sent from your turbine into AWS it’s also added to a data stream and pushed to your charts.
My work for the hackathon was to update Iot-App-Kit to support streaming data instead of long polling. The other two team members built out the infrastructure behind the scenes that would give me a web socket to connect to and receive data from.
Six weeks and two major holidays later we had a working prototype! We created slides, prepared a demo, and gathered data to provide a direct comparison between the two methods of loading data. The results were way better than we expected.
I created three different dashboards that differed in chart count and quantity of data. It was set up so I could directly swap out the current @iot-app-kit/source-sitewise package for my new @iot-app-kit/source-sitewise-ws package. At the topmost range of the tests, I had sixty charts on a single dashboard rendering the latest hour of data. That’s almost 216,000 data points!
I measured the time it took from when an empty chart was rendered on a page to it being fully filled in with data and updating live. I’m not an Excel expert, but below is the best bar chart I could come up with comparing the three tests.
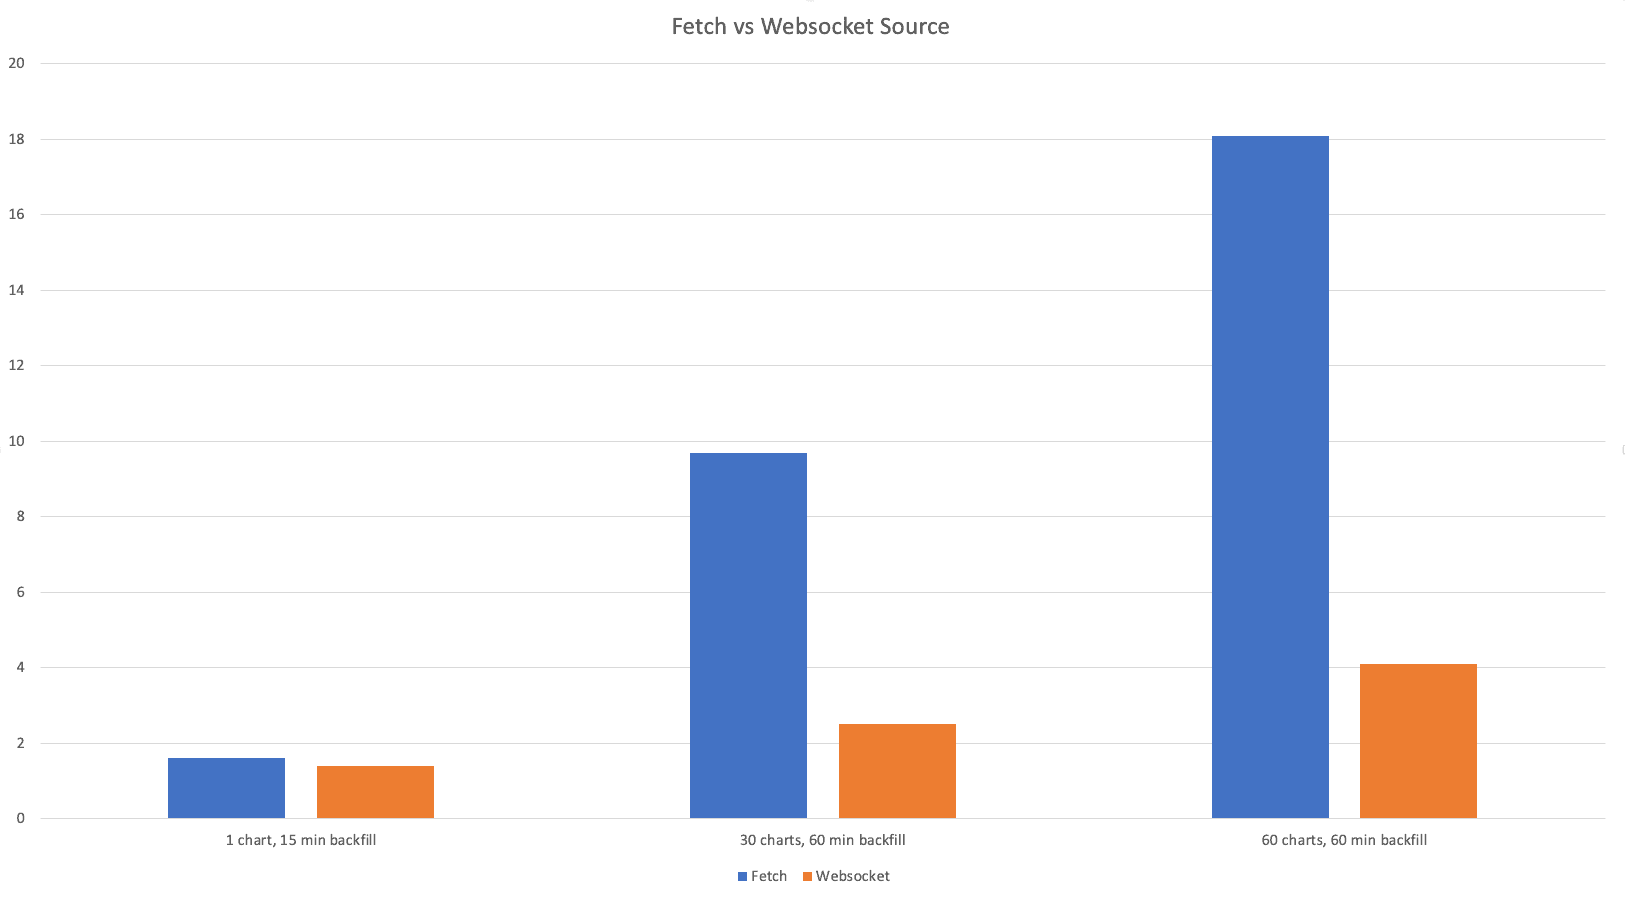
Ultimately, the web socket based implementation was ✨ 441% faster at scale ✨. These aren’t behind-the-scenes improvements either. Our end customers user experience was that much faster. We’re cutting down tens of seconds of load time when they open a large dashboard.
From a technical perspective, our project also opened up new possibilities like rendering hundreds of charts at once. This would be impossible with long polling due to request throttling by the browser. We achieved the lowest possible latency for live data, reduced backend cost by replacing the current inefficient polling method, and improved the frontend development experience by handling many requests over the same connection.
Our demo went well and got great reception throughout the AWS IIoT organization. The hackathon had 88 participants, 33 project ideas, and 13 submissions. A panel of four judges deemed our “Iot-App-Kit WebSocket Streaming” to be the Best Overall Hack. We also won the People’s Choice award when the organization was polled after presentation day!
The hackathon was a non-required effort, but I’m glad I participated! It’s been one of the best learning experiences I’ve had throughout my career. I worked with people who weren’t even on my primary team at AWS, was challenged by solving problems I never had worked on before and delivered a technical presentation to nearly a hundred people!
I encourage other developers to take on something outside of their comfort zone this year. Difficult features in your backlog, bugs that won’t go away, anything that will push you beyond what you’re already competent with. You never know what you’ll learn!